
2.3.2 - Rose Curves#
- Duration:
20 minutes
- Level:
Beginner
Overview#
Rose curves are among the most elegant mathematical patterns, creating flower-like shapes through a beautifully simple polar equation. Named after their resemblance to botanical roses, these curves have fascinated mathematicians since the 18th century when Italian mathematician Guido Grandi first studied them. In this exercise, you will learn to create rose curves programmatically, discovering the surprising relationship between a single parameter and the number of petals.
Learning Objectives
By the end of this exercise, you will be able to:
Understand the rose curve polar equation: r = a * cos(k * theta)
Predict the number of petals based on the k parameter (odd k vs even k)
Convert polar coordinates to Cartesian coordinates for drawing
Create variations of rose curves by modifying parameters
Quick Start#
Let’s create a rose curve immediately and see the result:
 1import numpy as np
 2from PIL import Image, ImageDraw
 3from pathlib import Path
 4
 5SCRIPT_DIR = Path(__file__).parent
 6
 7# Canvas settings
 8CANVAS_SIZE = 512
 9CENTER = CANVAS_SIZE // 2
10BACKGROUND_COLOR = (15, 15, 25)
11ROSE_COLOR = (255, 100, 150)
12
13# Rose curve parameters
14K_PARAMETER = 5      # Number of petals (for odd k)
15AMPLITUDE = 180      # Size of the rose
16
17# Create canvas
18image = Image.new('RGB', (CANVAS_SIZE, CANVAS_SIZE), BACKGROUND_COLOR)
19draw = ImageDraw.Draw(image)
20
21# Generate rose curve: r = a * cos(k * theta)
22theta = np.linspace(0, 2 * np.pi, 1000)
23r = AMPLITUDE * np.cos(K_PARAMETER * theta)
24
25# Convert polar to Cartesian
26x = CENTER + r * np.cos(theta)
27y = CENTER + r * np.sin(theta)
28
29# Draw the rose
30points = list(zip(x.astype(int), y.astype(int)))
31draw.line(points, fill=ROSE_COLOR, width=2)
32
33image.save(SCRIPT_DIR / 'simple_rose.png')
Download simple_rose.py and run it to generate this output:
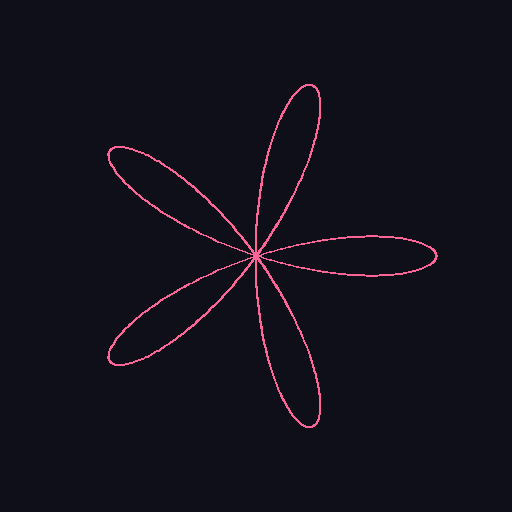
A rose curve with k=5 creates exactly 5 petals. The curve passes through the center where adjacent petals meet.#
Tip
The rose curve equation r = a * cos(k * theta) is remarkably simple, yet produces complex, beautiful patterns. The single parameter k controls the entire structure of the flower.
Core Concepts#
Concept 1: The Rose Curve Equation#
The rose curve (also called rhodonea curve) is defined by the polar equation:
Where:
r is the radius (distance from center)
a is the amplitude (maximum petal length)
k is the petal parameter (determines petal count)
theta is the angle (in radians)
To draw on a pixel canvas, we convert from polar to Cartesian coordinates:
import numpy as np

# Generate points along the rose curve
theta = np.linspace(0, 2 * np.pi, 1000)
r = amplitude * np.cos(k * theta)

# Convert to pixel coordinates (centered on canvas)
x = center_x + r * np.cos(theta)
y = center_y + r * np.sin(theta)
Note
An alternative form uses sine instead of cosine: r = a * sin(k * theta). This rotates the rose by 90 degrees but produces the same shape. Some sources call the cosine form “rose” and sine form “rhodonea.”
Did You Know?
The rose curve was first studied by Italian mathematician Guido Grandi in 1723, who named it “rhodonea” from the Greek word for rose. Grandi was investigating curves that could be drawn with a compass-like mechanism [Grandi1723].
Concept 2: The k Parameter and Petal Count#
The most fascinating property of rose curves is the relationship between k and the number of petals:
For odd k: The rose has exactly k petals
For even k: The rose has exactly 2k petals
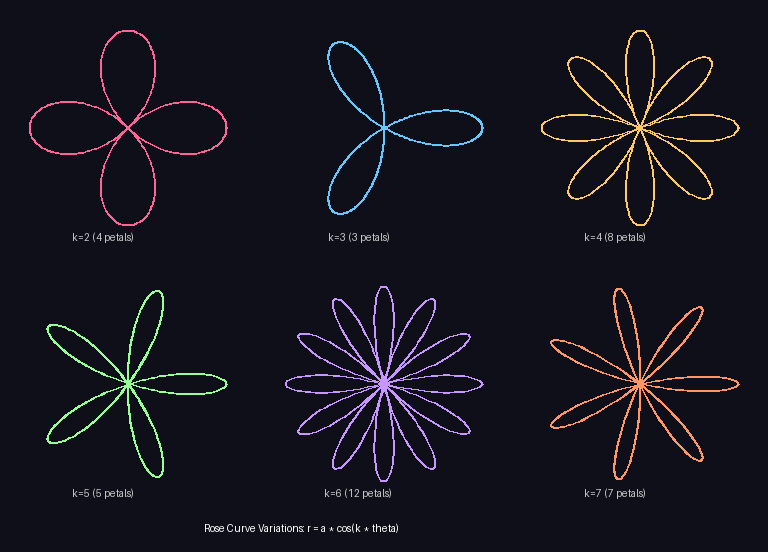
Rose curve variations showing the relationship between k and petal count. Top row: k=2 (4 petals), k=3 (3 petals), k=4 (8 petals). Bottom row: k=5 (5 petals), k=6 (12 petals), k=7 (7 petals).#
Why does this happen?
The mathematical explanation involves how the cosine function interacts with the angle:
When k is odd, the curve traces each petal twice (once with positive r, once with negative r that overlaps), resulting in k visible petals
When k is even, positive and negative r values trace different petals, doubling the count to 2k petals
def get_petal_count(k):
    """Return the number of petals for a given k value."""
    if k % 2 == 0:  # Even k
        return 2 * k
    else:           # Odd k
        return k

# Examples:
# k=3 -> 3 petals (odd)
# k=4 -> 8 petals (even)
# k=5 -> 5 petals (odd)
# k=6 -> 12 petals (even)
Important
When k is a rational number (like 2/3 or 5/7), the rose curve becomes more complex, requiring multiple rotations to close. Integer values of k always produce closed curves within one full rotation.
Concept 3: Drawing Rose Curves with NumPy#
Drawing a rose curve follows the same pattern as the spiral from Module 2.2.2, but with a different radius formula:
import numpy as np
from PIL import Image, ImageDraw

# 1. Generate angle values covering the full curve
theta = np.linspace(0, 2 * np.pi, 1000)

# 2. Calculate radius using rose equation
k = 5
amplitude = 180
r = amplitude * np.cos(k * theta)

# 3. Convert to Cartesian coordinates
center = 256
x = center + r * np.cos(theta)
y = center + r * np.sin(theta)

# 4. Draw as connected line segments
points = list(zip(x.astype(int), y.astype(int)))
draw.line(points, fill=(255, 100, 150), width=2)
Key differences from spirals:
Spiral:
r = a + b * theta(radius grows with angle)Rose:
r = a * cos(k * theta)(radius oscillates with angle)
The oscillating radius is what creates the petal pattern - when cosine is positive, the curve extends outward; when negative, it traces in the opposite direction.
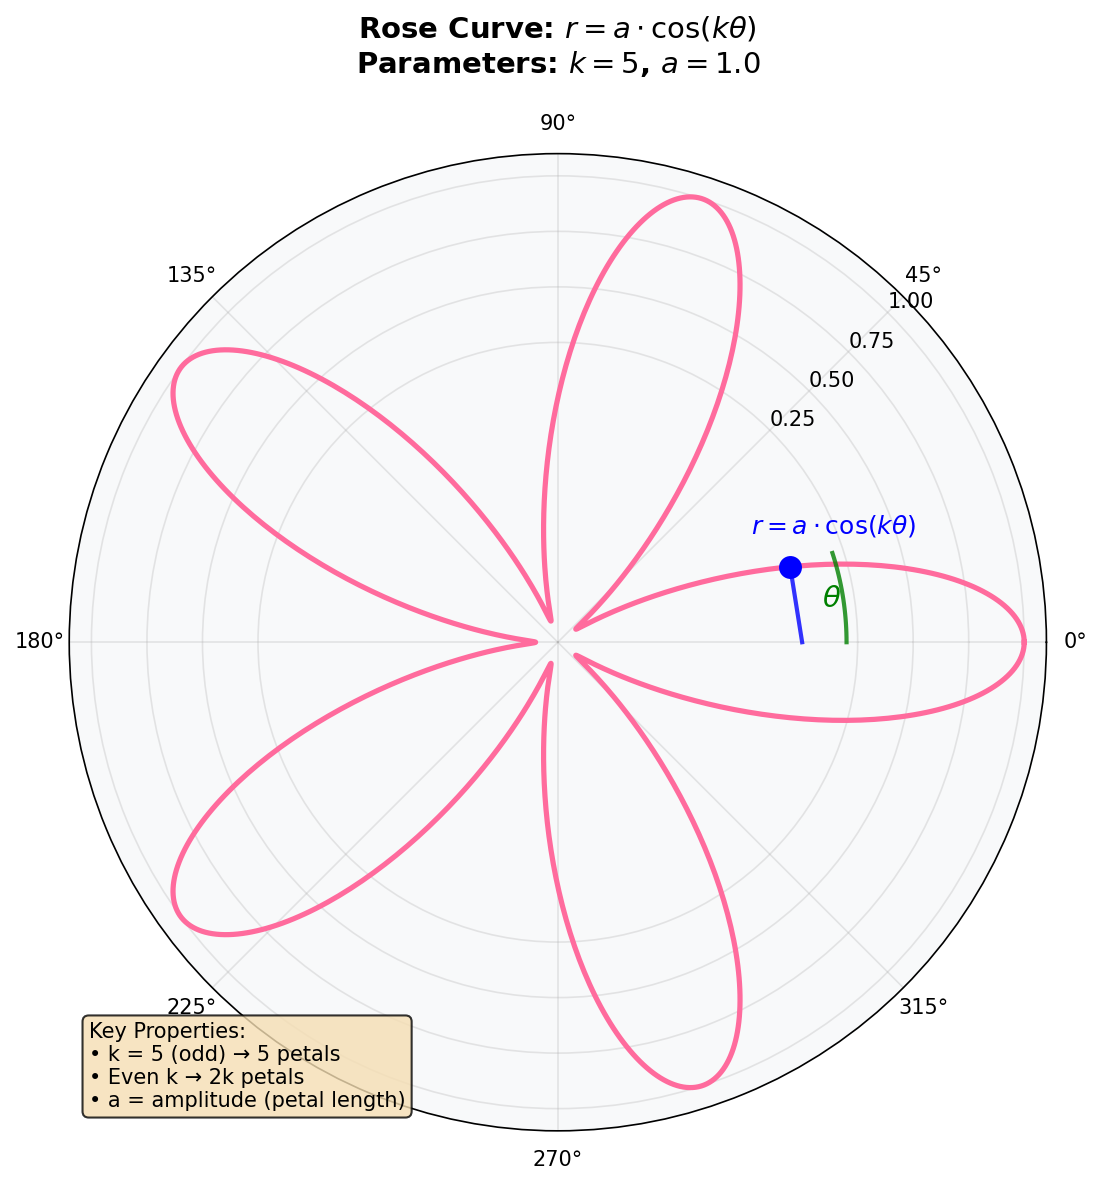
The rose curve in polar coordinates. The radius r varies with angle theta according to the cosine function, creating the characteristic petal shape. Diagram generated with Claude - Opus 4.5.#
Tip
If you completed Module 2.2.2 (Spiral), you already know most of what you need! The polar-to-Cartesian conversion is identical - only the radius formula changes.
Hands-On Exercises#
Exercise 1: Execute and Explore#
Run the simple_rose.py script and observe the output.
python simple_rose.py
Reflection Questions
How many petals does the rose have? Why this number?
What is the value of
K_PARAMETERin the code?What happens at the center of the rose where petals meet?
Answers
5 petals: The rose has 5 petals because
K_PARAMETER = 5and 5 is odd. For odd k, the rose curve produces exactly k petals.K_PARAMETER = 5: This value directly controls the petal count. Changing it will change how many petals appear.
Petals meet at the origin: At the center,
r = 0whenevercos(k * theta) = 0. This occurs at angles where the curve transitions from one petal to the next. The petals share the center point as a common vertex.
Exercise 2: Modify Parameters#
Modify the parameters in simple_rose.py to achieve these goals:
Goals
Create a 4-petal rose (hint: what k gives 2k = 4?)
Create an 8-petal rose
Make the rose larger by adjusting the amplitude
Hint for Goal 1
For 4 petals with an even k: since 2k = 4, we need k = 2. Even values of k produce twice as many petals as the k value itself.
Hint for Goal 2
For 8 petals, you could use k=4 (even: 2*4=8) or try other approaches. What odd k would give you a nearby petal count?
Complete Solutions
# Goal 1: 4-petal rose
K_PARAMETER = 2    # Even k=2 gives 2*2=4 petals

# Goal 2: 8-petal rose
K_PARAMETER = 4    # Even k=4 gives 2*4=8 petals

# Goal 3: Larger rose
AMPLITUDE = 220    # Increase from 180 to 220 (or any larger value)
                   # Be careful not to exceed CANVAS_SIZE // 2
Key insights:
For 4 petals: use k=2 (even), which gives 2k=4 petals
For 8 petals: use k=4 (even), which gives 2k=8 petals
Amplitude controls the maximum radius - the distance from center to petal tip
Exercise 3: Create a Colored Rose#
Create a rose where each petal has a different color. This requires determining which petal you’re drawing based on the current angle.
Requirements
Use k=5 for 5 petals
Assign each petal a unique color from a palette
The color should change smoothly as you move between petals
Starter Code
# Color palette for 5 petals
PETAL_COLORS = [
    (255, 100, 100),   # Red
    (255, 200, 100),   # Orange
    (255, 255, 100),   # Yellow
    (100, 255, 100),   # Green
    (100, 100, 255),   # Blue
]

def get_petal_color(theta_value, k):
    """
    Determine which petal color to use based on angle.

    TODO: Implement this function!
    Hint: Map theta to a petal index (0 to k-1)
    """
    # YOUR CODE HERE
    return PETAL_COLORS[0]  # Currently returns only red
Hint 1: Understanding Petal Regions
For a 5-petal rose (k=5), the argument k * theta goes through 5 complete cycles of the cosine function as theta goes from 0 to 2*pi. Each petal corresponds to one “positive hump” of this cosine wave.
Hint 2: Mapping Angle to Petal Index
Use the formula: petal_index = int(theta * k / pi) % k
This works because each petal spans an angular region related to pi/k radians, and we want to cycle through k colors.
Complete Solution
 1import numpy as np
 2from PIL import Image, ImageDraw
 3from pathlib import Path
 4
 5SCRIPT_DIR = Path(__file__).parent
 6CANVAS_SIZE = 512
 7CENTER = CANVAS_SIZE // 2
 8K_PARAMETER = 5
 9AMPLITUDE = 180
10
11PETAL_COLORS = [
12    (255, 100, 100), (255, 200, 100), (255, 255, 100),
13    (100, 255, 100), (100, 100, 255)
14]
15
16def get_petal_color(theta_value, k):
17    """Map angle to petal index and return corresponding color."""
18    petal_index = int((theta_value * k / np.pi)) % k
19    return PETAL_COLORS[petal_index % len(PETAL_COLORS)]
20
21image = Image.new('RGB', (CANVAS_SIZE, CANVAS_SIZE), (15, 15, 25))
22draw = ImageDraw.Draw(image)
23
24theta = np.linspace(0, 2 * np.pi, 1000)
25r = AMPLITUDE * np.cos(K_PARAMETER * theta)
26x = CENTER + r * np.cos(theta)
27y = CENTER + r * np.sin(theta)
28
29for i in range(1, len(theta)):
30    color = get_petal_color(theta[i], K_PARAMETER)
31    draw.line([(int(x[i-1]), int(y[i-1])), (int(x[i]), int(y[i]))],
32             fill=color, width=2)
33
34image.save(SCRIPT_DIR / 'colored_rose.png')
Key insights:
Line 16: The formula
int(theta * k / pi) % kdivides the angle range into k equal regionsLines 25-26: We draw each line segment with its own color based on the current angle
The modulo operator ensures the index wraps around within the color palette
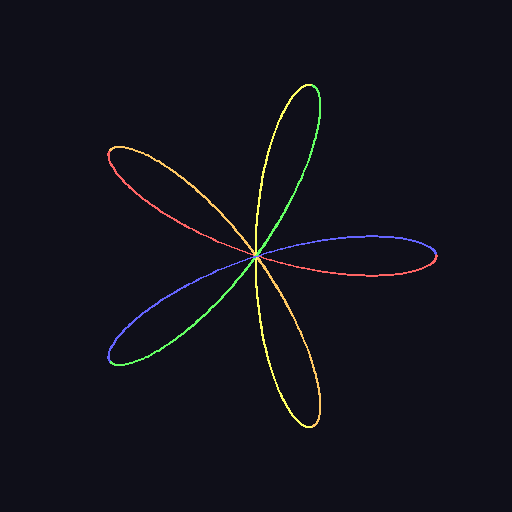
The completed colored rose with each of the 5 petals in a different color from the rainbow palette.#
Challenge Extension#
Ready for more? Try these advanced variations:
A. Rose Garden: Create multiple roses at different positions on the canvas, each with a different k value and color scheme.
B. Animated Rose: Create a GIF where the rose appears to “bloom” by gradually increasing the amplitude from 0 to the full size.
C. Nested Roses: Draw multiple roses with the same center but different k values (e.g., k=3, k=5, k=7) layered on top of each other.
D. Gradient Petals: Instead of solid colors, create petals where the color fades from the center (dark) to the tips (bright).
Summary#
In this exercise, you learned to create rose curves using polar equations and NumPy.
Key Takeaways
Rose curve equation:
r = a * cos(k * theta)creates flower-like patternsPetal count rule: Odd k produces k petals; even k produces 2k petals
Polar conversion:
x = r * cos(theta),y = r * sin(theta)translates to pixelsParameter effects: k controls structure (petal count), amplitude controls size
Building on spirals: The drawing technique transfers directly from Module 2.2.2
Common Pitfalls
Wrong petal count: Remember even k doubles the petals! k=4 gives 8 petals, not 4.
Incomplete curves: Ensure theta covers 0 to 2*pi for a complete rose.
Forgetting the center offset: Always add
center_xandcenter_ywhen converting to pixel coordinates.Amplitude too large: If amplitude exceeds half the canvas size, petals will be clipped.
References#
Grandi, G. (1723). Flores geometrici ex Rhodonearum, et Cloeliarum curvarum descriptione resultantes. Florence Academy Publications. [Original work introducing rose curves, named “rhodonea” from Greek for rose]
Weisstein, E. W. (2024). Rose. MathWorld - A Wolfram Web Resource. Retrieved November 30, 2025, from https://mathworld.wolfram.com/Rose.html [Comprehensive mathematical reference on rose curves]
NumPy Developers. (2024). numpy.linspace documentation. NumPy v1.26 Manual. Retrieved November 30, 2025, from https://numpy.org/doc/stable/reference/generated/numpy.linspace.html [Official documentation for generating evenly spaced arrays]
NumPy Developers. (2024). NumPy Trigonometric Functions. NumPy Documentation. Retrieved November 30, 2025, from https://numpy.org/doc/stable/reference/routines.math.html [Official documentation for cos, sin functions]
Clark, A., et al. (2024). Pillow: Python Imaging Library (Version 10.2.0) [Computer software]. Python Software Foundation. https://python-pillow.org/ [Image processing library used for drawing]
Livio, M. (2002). The Golden Ratio: The Story of Phi, the World’s Most Astonishing Number. Broadway Books. ISBN: 978-0-7679-0816-0 [Explores mathematical patterns in nature and art, including rose-like symmetries]
Pearson, M. (2011). Generative Art: A Practical Guide Using Processing. Manning Publications. ISBN: 978-1-935182-62-5 [Modern generative art techniques including parametric curves]
Lockwood, E. H. (1961). A Book of Curves. Cambridge University Press. [Classic mathematical reference covering rose curves and related parametric curves]